Azure application insights

Azure Application Insights
Application Insights is an Azure service that allows developers to monitor their applications in a centralized way, all the way from development through production. With the available data, software teams are able to proactively understand how their application is being used. In case of an incident, developers are able to reactively review metrics, logs and traces to find the root cause.
Image: Azure Application Insights logo
It is an essential tool to develop distributed applications and system at scale.
OpenTelemetry
When software teams or organizations manage multiple applications, it might be useful to collect all this data in a single place. Only by doing so we're able to see the entire picture of what's happening across all these systems. Doing so requires that logs, traces and metrics are generated in a standardized data format.

Image: OpenTelemetry Logo
This is where OpenTelemetry comes in. By standardizing the format in which data is collected, software teams can start using different products together without being vendor dependant.
Getting started
Create an Application Insights instance
Go to the Azure Portal and create a new Application Insights resource.

Image: Creating a new instance through the Azure Portal
After creating the instance, we can go to the Overview tab and copy the connection string

Image: Copying the connection string from the portal. Do not worry, the credentials shown here are not real
This connection string is always needed to connect to our instance of Application Insights.
Note
On March 31, 2025, support for instrumentation key ingestion will end. Instrumentation key ingestion will continue to work, but Microsoft will no longer provide updates or support for the feature. Connection strings will be the preferred way of connecting from now on.
Auto instrumentation (agents)
Auto instrumentation is the easiest way to start collecting data, without even having to make code changes. Various target environments, such as Azure Functions and Azure App Service even enable Azure Insights logging by default!
See the app insights overview for an overview of the multiple auto-instrumentation possibilities for different languages.
Logging in DotNET
If you're writing dotnet code, changes are high you're using a logging library. Most commonly used logging libraries provide a way to determine multiple targets for you logging data. E.g. you might want to log to both a file on disk and to Azure Insights.
Log4net
Log4net has a logging appender which is available through a NuGet package.
After adding the package to the dotnet application, we can update the log4net config file to include the new appender.
Serilog
Serilog has a logging sink to send the collected logs to Application Insights.
The sink can be configured in code in the following way:
Nlog
Nlog has a logging target package which can be used to direct the logs to Application Insights.
The following configuration can be used to set up the logging target with the correct instrumentation key or connection string:
Manual data collection
Besides using a logging target, we can also 'manually' create a metric, trace or log. Microsoft provides a SDK through a Nuget package to easily interact with your instance. In dotnet we can do this in the following way:
The TrackTrace method accepts 3 arguments:
- Message : The string you want to log
- Level : The level you want to log. Can be Verbose | Information | Warning | Error | Critical
- Props: An object that implements IDictionary that can hold multiple key-value pairs.
The dictionary could for example contain the following information:
This way we can add our own custom data fields to the log traces.
Inspecting the data
We can verify that our data collection is working by going to the Azure Portal and visiting our instance. We can view the logs under Monitoring > Logs. The portal allows us to query our data using KQL, the Kusto Query Language.
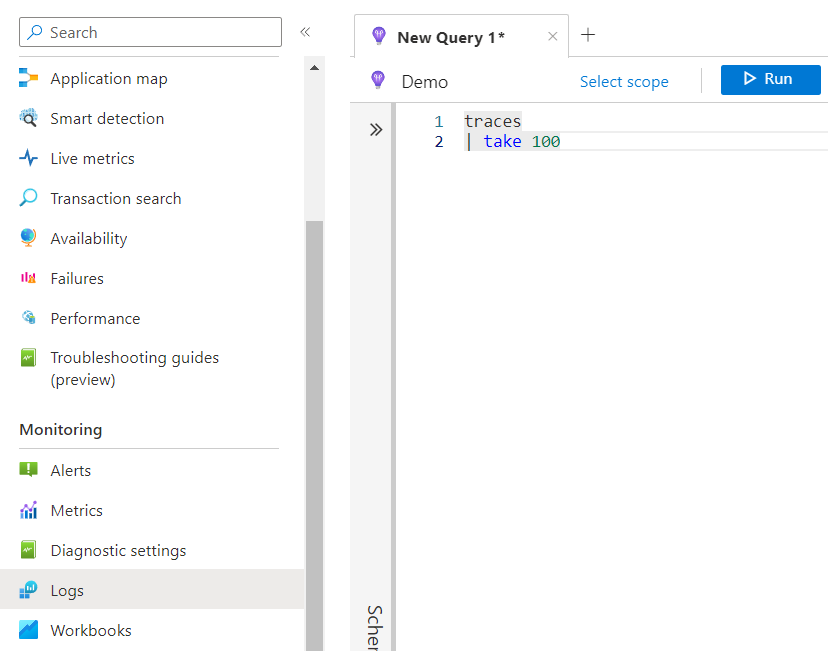
Image: Inspecting the collected logs using the Azure Portal
If we would like to inspect the last 100 traces we generated using the above dotnet code, we could perform the following query:
Please make note of the | (pipe) symbol used in KQL. If we would like to see which log lines contain a certain string, we could do this by adding a where clause:
Query data in the customDimensions field using the following syntax:
Visualising data using dashboards
While it is beyond the scope of this article, you can visualize the collected data by using dashboards.
Azure Dashboard
Azure offers a dashboard service on its own. This service can also be created through the Azure Portal.
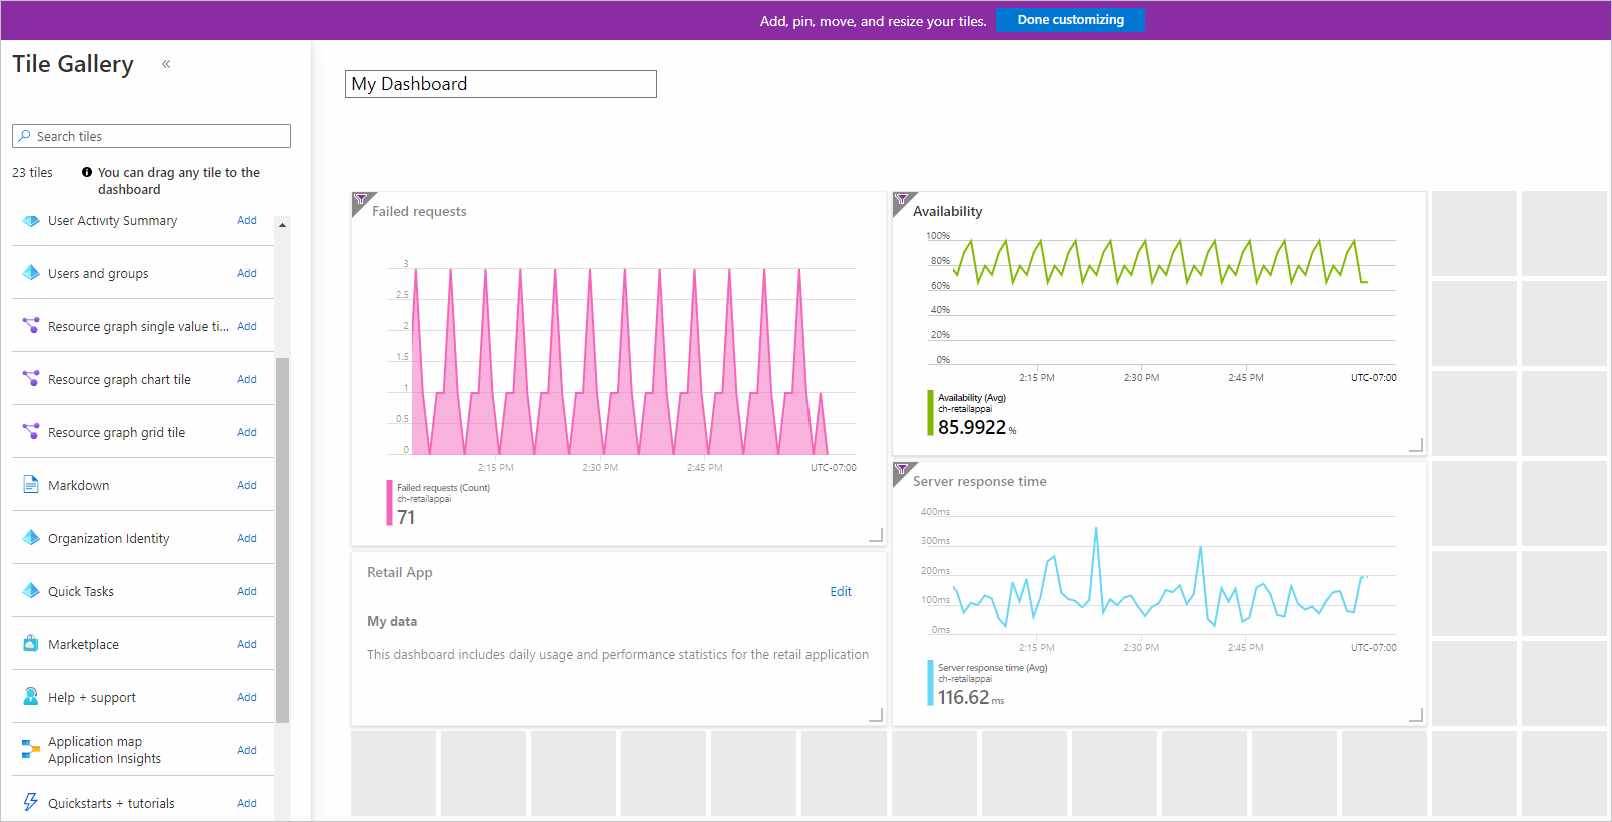
Image: Azure Dashboard
3rd party dashboards
But because we collected our data in a vendor independent format, we can integrate Application Insights with many 3rd party dashboard tools, such as Grafana
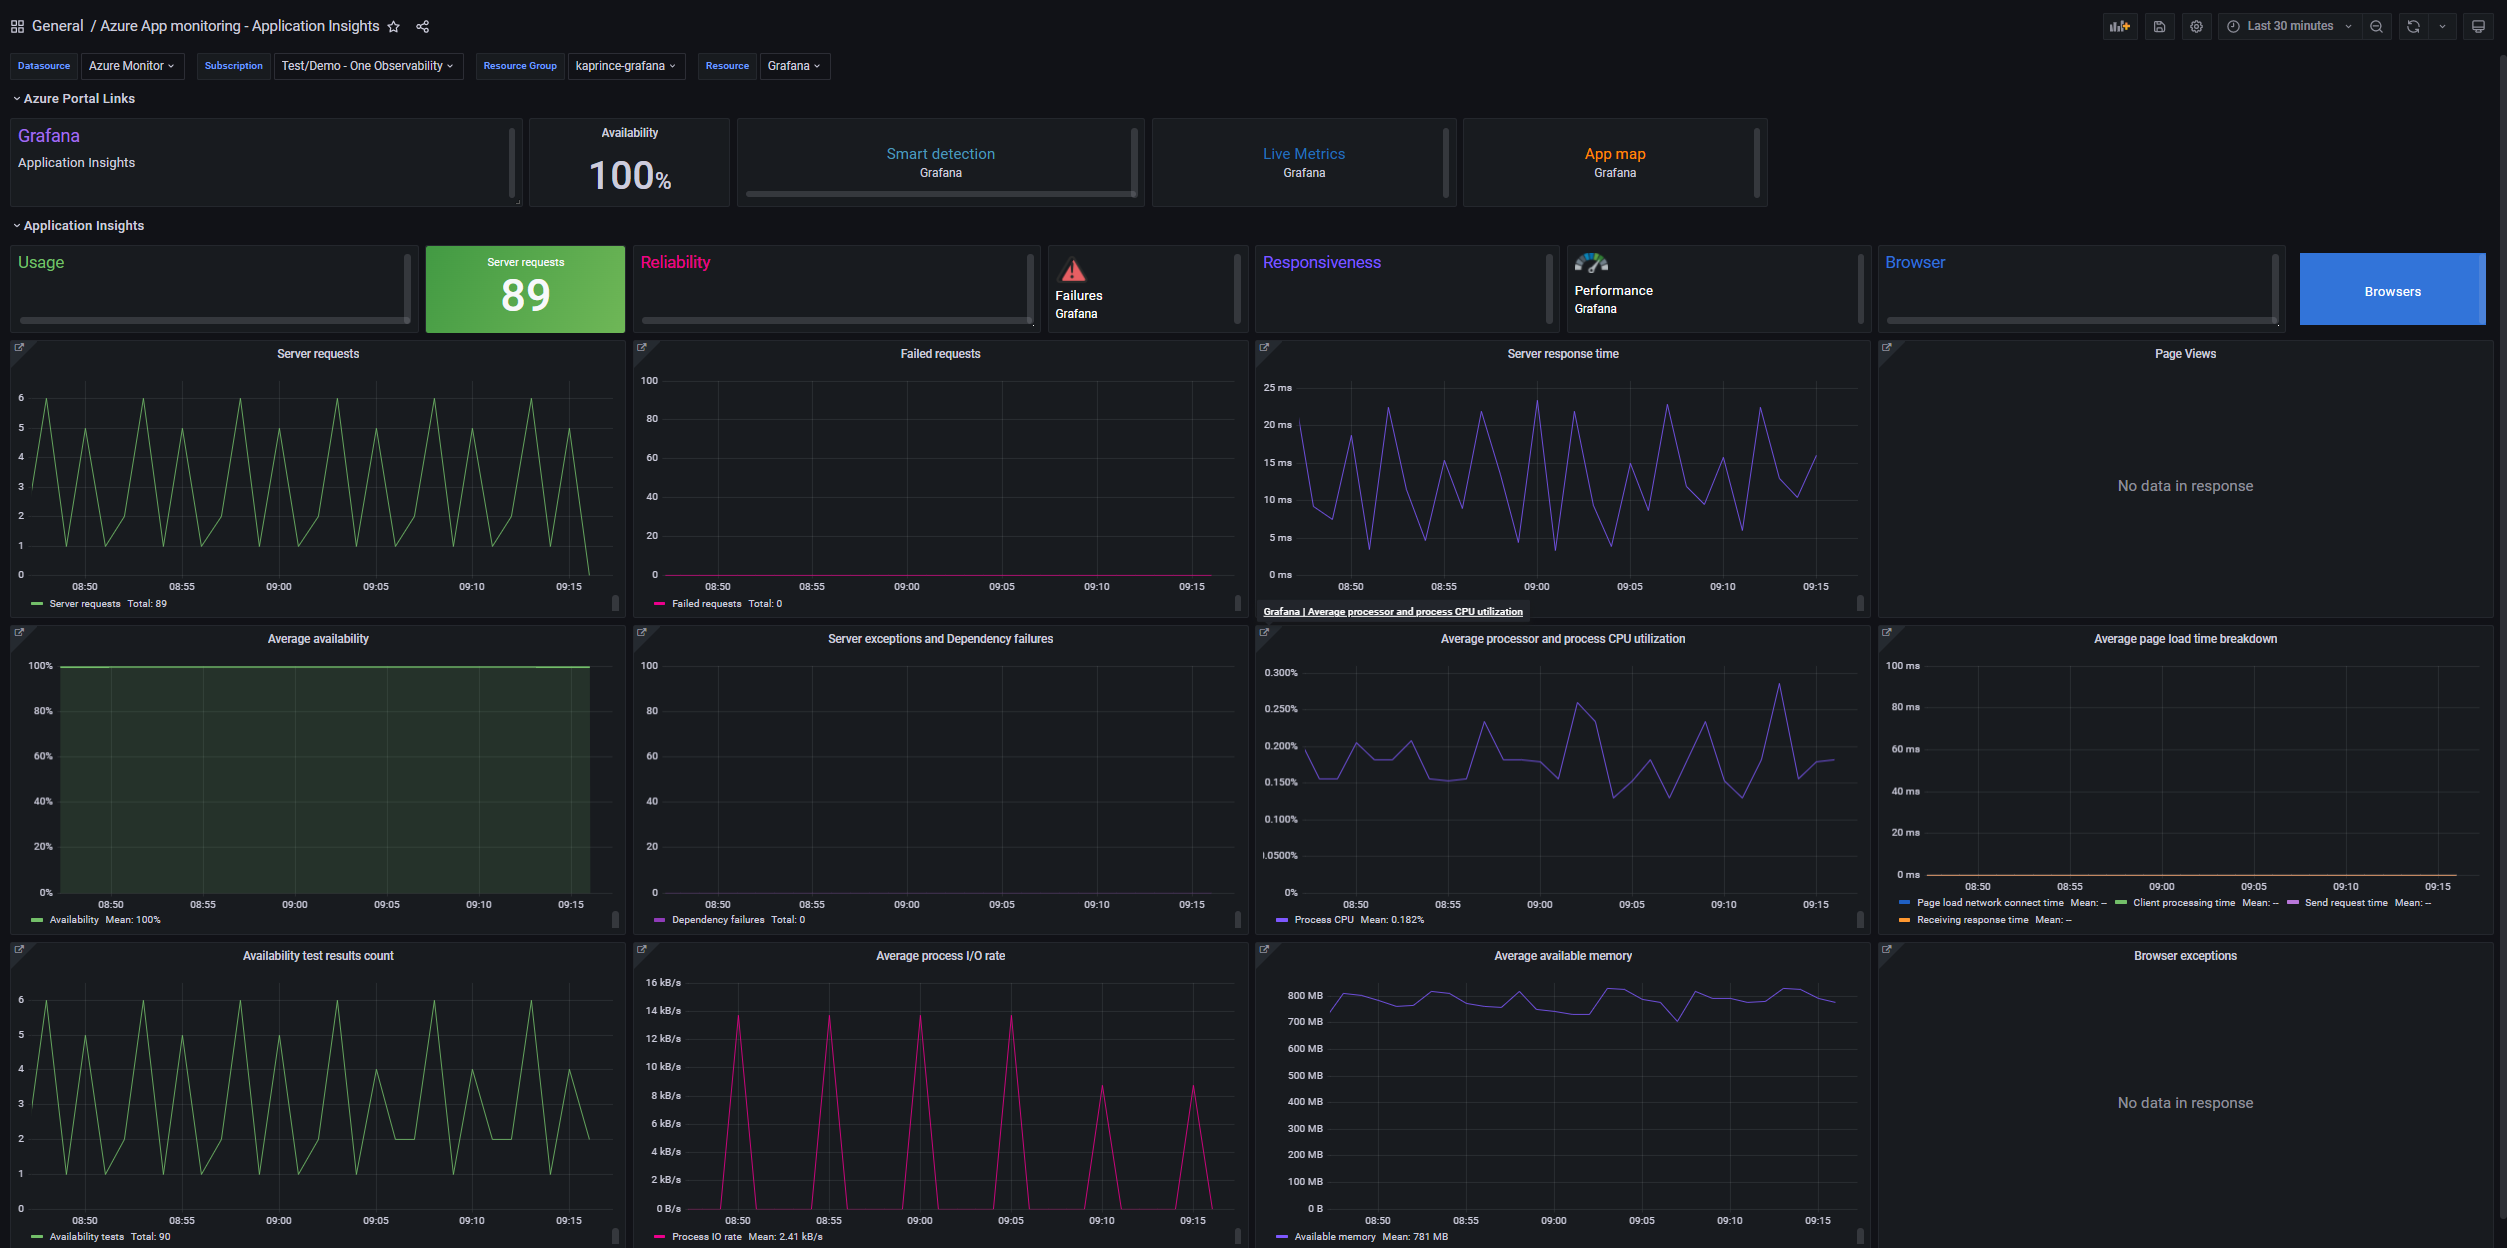
Image: Many 3rd party options, such as Grafana, exist
Summary
Application Insights provides various ways to integrate data logging in our existing or new applications. This can be done both by making configuration changes (auto-instrumentation) or by making minor code changes. It allows us to collect metrics, logs and traces in a standard data format, made possible by OpenTelemetry. This open data format prevents vendor lock-in, and allows us to integrate our data with many 3rd party tools and systems.
Do let me know if you spot any mistakes or inaccuracies. All feedback is welcome! Jef
Further reading
- https://learn.microsoft.com/en-us/azure/azure-monitor/app/ilogger
- https://stackoverflow.com/questions/28800320/log4net-with-application-insights
- https://github.com/serilog-contrib/serilog-sinks-applicationinsights
- https://www.nexsoftsys.com/articles/integrating-apps-insights-with-nlog-aspnet-core.html
- https://www.nuget.org/packages/Microsoft.ApplicationInsights.NLogTarget
- https://learn.microsoft.com/en-us/azure/data-explorer/kusto/query/